Several weeks ago Joshua Pearce at Clarion University in Pennsylvania released a study titled “ Thermodynamic limitations to nuclear energy deployment as a greenhouse gas mitigation technology .” In the study he stated... nuclear energy production would have to increase by 10.5% per year from 2010 to 2050 to both replace fossil-fuel-energy use and meet the future energy demands. This line, of course, made the headlines and has been picked up by several outlets and blogs . When looking into his calculations for this statement, he made one assumption error that overstated the above sentence by nearly a factor of three. Page 121, Section 4.1 of the study states: Richard Smalley pointed out that in 2004, the global economy consumed the equivalent of 220 million barrels of oil per day, which converted into electricity terms is the equivalent of 14.5 TeraWatts (TW), or 14,500,000 MegaWatts (MW) (2005). … With a nuclear plant having about 1000 MW (1 GW) of capacity, we would need 14,500...

Comments
Ingenious summary of how people see nuclear power plants. The fact that maxing out the plant is rather normal, and that a meltdown is only possible after a horrible accident, is somewhat missed. :/
This program is especially guilty of this.
Other interesting details:
-The plant is a 20MWe PWR
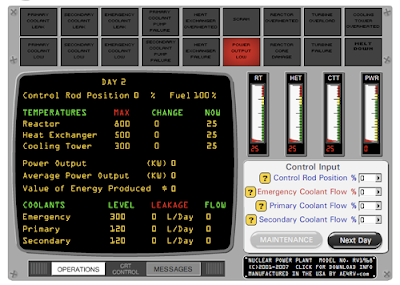
-The GUI has 18 annunciator lights, including the comical "Power Output Low" and "Meltdown".
-The GUI outputs four properties that characterize the plant state: Reactor Temperature, Steam Generator Temperature, Cooling Tower Temperature, and Reactor Power, all on analog scales with handy green, yellow and red bands so the operator knows whether the number is OK.
-The operator has control of the Control Rod Positions, Primary Coolant Flow, Secondary Coolant Flow, and Emergency Coolant Flow, all adjustable from 0-100% rated flow.
-The operator can only adjust these variables once per game-day, after which the plant conditions are updated. All transients literally take "days".
I'm a bit curious which equations the simulation is using, but no such information is provided by the website or demo.
Also did anyone else notice the reactor coolant flow diagram? The coolant seems to around the core (down the downcomer, below the core, and back up the downcomer) rather than through it.