Tonight, a hearing will take place on Exelon's early site permit for building another reactor on the Clinton nuclear power station. We can assume that the opponents are gearing up for this hearing as well. And at their disposal they have some misinformation on the health effects of the Clinton station.
Presentation slides shown on the No New Nukes website claims the Clinton nuclear plant in Illinois is responsible for an increase in infant mortality and breast cancer deaths. According to the presentation, the Clinton plant shut down in September, 1996 and restarted in June, 1999, almost a three year outage. As a result, the presentation claims, infant mortality and breast cancer deaths decreased from the shutdown period and increased once the plant started back up.
The Illinois Department of Public Health website indicates that No New Nukes reports the annual number of infant deaths correctly. However, the numbers are presented in a way that suggests operation of the Clinton plant and the annual number of infant deaths are linked. A cursory examination of the No New Nukes analysis reveals significant flaws in their work that undermine its credibility.
Prevailing Winds
In slide 7 of the presentation, the first bullet indicates that prevailing winds are from the southwest. Two figures below show the wind roses from the Illinois’ State Climatologist Office on the cities of Springfield located in Sangamon County and Peoria located in Peoria County. For this discussion, both are reasonable approximations of winds near the Clinton plant. These diagrams indicate winds blow primarily from the south and south-southwest.

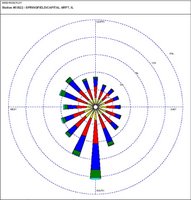 By the reasoning of No New Nukes, one would expect counties to the north and north-northeast to be most affected by the Clinton plant. The presentation identifies these as the counties of De Witt, Piatt, Champaign, Moultrie, Douglas and Coles, and says they show a “statistically significant increase in infant mortality after re-start.” Yet all but DeWitt – the county in which the plant is sited – are located to the east, southeast, and south of the plant site, not in the direction of the prevailing winds. Did the wind somehow make a U turn at the Clinton plant? It should be noted, as well, that No New Nukes’ own slide below indicates that the counties to the north show no statistically significant change in infant mortality after restart of the Clinton plant.
 Correlation with Plant Shutdown
One of the No New Nukes slides presents numbers of infant deaths in three three-year periods to suggest there is a correlation between fluctuations in infant deaths and the plant’s 1996-1999 shutdown. Examination of the year-by-year counts for the five counties surrounding the Clinton plant suggests otherwise. The chart below shows the year-to-year variation in the numbers.
 The No New Nukes presentation cites breast cancer data taken from the Illinois’ Department of Public Health IPLAN database. However, NEI’s queries of the IPLAN database were unable to recreate the data No New Nukes claims to have obtained from there. The data obtained by NEI is close, but not identical to that shown in the No New Nukes presentation.
When looking at the table of breast cancer fatalities shown on No New Nukes’ slide 14 or the chart below, readers are unlikely to discern any link between the Clinton shutdown and the number of breast cancer deaths. The data in the No New Nukes slide shows that deaths went up when the plant shut down, but also went down when the plant started back up. They claim the data “suggests a 3-year lag.” Without explanation, they claim that three years after the plant shutdown, the area will see a decrease in breast cancer deaths. If that was true, one wonders why the years prior to shutdown also have a lower number of deaths than during shutdown.
 Also, by their reasoning, if the plant restarted in 1999, one would expect to see an increase in the number of breast cancer deaths starting in 2002. Although one sees an increase from the previous year, there is a decrease in the subsequent year. The correlation claimed by No New Nukes is not obvious in a year-by-year examination of the data.
Cause of Deaths
The biggest weakness of the No New Nukes piece of work is that they do not provide any information on what the causes of deaths were for infants. While that is not something we analyzed here, if someone is going to make the claim that the two are linked, it should be an obvious task to study why the infants died.
Other Works
Other nuclear power opponents have cited the works of Mangano, Sternglass, and Stewart in attempting to show correlations between infant mortality, breast cancers, etc., and operation of a particular nuclear power plant. Credentialed epidemiologists who have looked at their works with rigor and objectivity have consistently concluded that the analyses are flawed. Epidemiologists have found no measurable difference in the health of populations near operating nuclear plants. NEI Fact Sheets on this subject are available at the following URLs:
http://www.nei.org/index.asp?catnum=3&catid=1137
http://www.nei.org/index.asp?catnum=3&catid=1112
http://www.nei.org/index.asp?catnum=3&catid=310
Technorati tags: Nuclear Energy, Nuclear Power, Environment, Energy, Politics, Technology, Economics, Clinton ESP, Illinois, Exelon
Presentation slides shown on the No New Nukes website claims the Clinton nuclear plant in Illinois is responsible for an increase in infant mortality and breast cancer deaths. According to the presentation, the Clinton plant shut down in September, 1996 and restarted in June, 1999, almost a three year outage. As a result, the presentation claims, infant mortality and breast cancer deaths decreased from the shutdown period and increased once the plant started back up.
The Illinois Department of Public Health website indicates that No New Nukes reports the annual number of infant deaths correctly. However, the numbers are presented in a way that suggests operation of the Clinton plant and the annual number of infant deaths are linked. A cursory examination of the No New Nukes analysis reveals significant flaws in their work that undermine its credibility.
Prevailing Winds
In slide 7 of the presentation, the first bullet indicates that prevailing winds are from the southwest. Two figures below show the wind roses from the Illinois’ State Climatologist Office on the cities of Springfield located in Sangamon County and Peoria located in Peoria County. For this discussion, both are reasonable approximations of winds near the Clinton plant. These diagrams indicate winds blow primarily from the south and south-southwest.

 By the reasoning of No New Nukes, one would expect counties to the north and north-northeast to be most affected by the Clinton plant. The presentation identifies these as the counties of De Witt, Piatt, Champaign, Moultrie, Douglas and Coles, and says they show a “statistically significant increase in infant mortality after re-start.” Yet all but DeWitt – the county in which the plant is sited – are located to the east, southeast, and south of the plant site, not in the direction of the prevailing winds. Did the wind somehow make a U turn at the Clinton plant? It should be noted, as well, that No New Nukes’ own slide below indicates that the counties to the north show no statistically significant change in infant mortality after restart of the Clinton plant.
 Correlation with Plant Shutdown
One of the No New Nukes slides presents numbers of infant deaths in three three-year periods to suggest there is a correlation between fluctuations in infant deaths and the plant’s 1996-1999 shutdown. Examination of the year-by-year counts for the five counties surrounding the Clinton plant suggests otherwise. The chart below shows the year-to-year variation in the numbers.
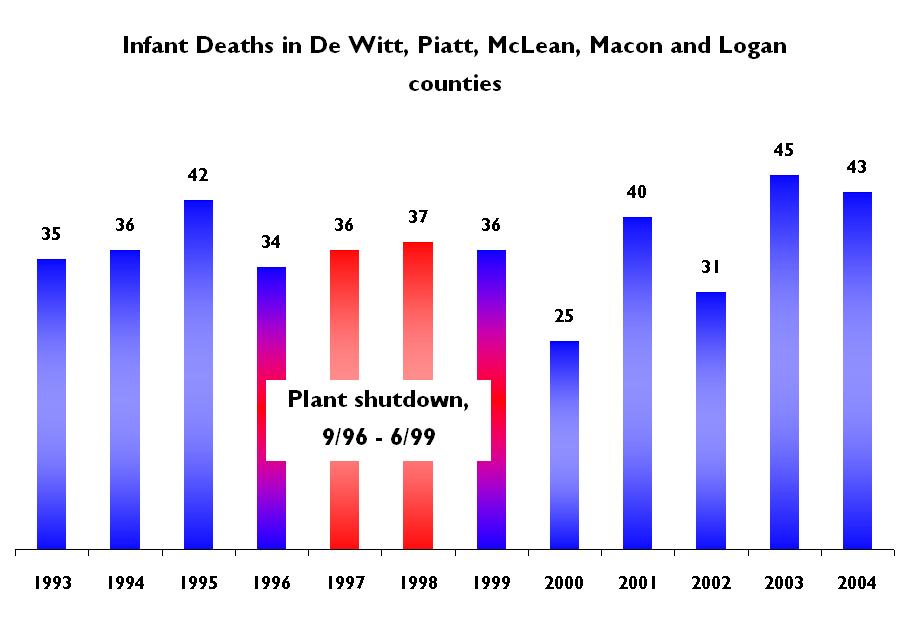 The No New Nukes presentation cites breast cancer data taken from the Illinois’ Department of Public Health IPLAN database. However, NEI’s queries of the IPLAN database were unable to recreate the data No New Nukes claims to have obtained from there. The data obtained by NEI is close, but not identical to that shown in the No New Nukes presentation.
When looking at the table of breast cancer fatalities shown on No New Nukes’ slide 14 or the chart below, readers are unlikely to discern any link between the Clinton shutdown and the number of breast cancer deaths. The data in the No New Nukes slide shows that deaths went up when the plant shut down, but also went down when the plant started back up. They claim the data “suggests a 3-year lag.” Without explanation, they claim that three years after the plant shutdown, the area will see a decrease in breast cancer deaths. If that was true, one wonders why the years prior to shutdown also have a lower number of deaths than during shutdown.
 Also, by their reasoning, if the plant restarted in 1999, one would expect to see an increase in the number of breast cancer deaths starting in 2002. Although one sees an increase from the previous year, there is a decrease in the subsequent year. The correlation claimed by No New Nukes is not obvious in a year-by-year examination of the data.
Cause of Deaths
The biggest weakness of the No New Nukes piece of work is that they do not provide any information on what the causes of deaths were for infants. While that is not something we analyzed here, if someone is going to make the claim that the two are linked, it should be an obvious task to study why the infants died.
Other Works
Other nuclear power opponents have cited the works of Mangano, Sternglass, and Stewart in attempting to show correlations between infant mortality, breast cancers, etc., and operation of a particular nuclear power plant. Credentialed epidemiologists who have looked at their works with rigor and objectivity have consistently concluded that the analyses are flawed. Epidemiologists have found no measurable difference in the health of populations near operating nuclear plants. NEI Fact Sheets on this subject are available at the following URLs:
http://www.nei.org/index.asp?catnum=3&catid=1137
http://www.nei.org/index.asp?catnum=3&catid=1112
http://www.nei.org/index.asp?catnum=3&catid=310
Technorati tags: Nuclear Energy, Nuclear Power, Environment, Energy, Politics, Technology, Economics, Clinton ESP, Illinois, Exelon
Comments
I looked briefly at the infant mortality numbers on the "No New Nukes" site. As your article accurately illustrates, the surrounding counties show no effect so a lopsided selection is made to take advantage of normal statisitical variation and contrive a result. The most telling and indefensible omission is that of McLean County directly to the north of the plant - but of course that shows the "wrong" effect for their preordained conclusion, so is omitted. A shocking abuse of process.
I disagree that a mechanism must be shown to raise a concern; this isn't always necessary, and medicine in particular has a history of using (or not using) treatments without knowing the mechanism. If sufficient high-quality statistics can be gathered to show a correlation and eliminate other reasonable hypotheses, you would have to act as if the mechanism was there. Your main argument is then that they haven't looked seriously for other possibilities. Actually what's going on is data fabrication, so the other possibilities don't exist either.
However your point about radiation is an excellent one, all the better because radiation is relatively easy to detect at ultra-low levels (which cuts both ways - anti-nukes use this too, of course, and ignore the "ultra-low" bit).