Last Friday, my colleague Eric McErlain informed me that Amory Lovins, CEO of the Rocky Mountain Institute, had responded to a post I wrote back in July titled Rocky Mountain’s Real-World Data Blunders:
My 1st count:
2nd count:
3rd count:
4th count:
When going back through my post, I found Mr. Lovins was correct about using global data versus U.S. All of his points used world figures, while most of my references were U.S specific.
After spending a couple of days checking out Mr. Lovins’ new analysis from the link in his comment, there are several issues I would like to discuss: costs, deployment and climate change.
Costs
Throughout the analysis, the author claims that nuclear power has no future because of its “bad economics.” Mr. Lovins bases nuclear’s entire economic case on one study done by MIT. Yet the study's purpose was to give an analysis of how and why nuclear power needs to be “an important option for the United States and the world to meet future energy needs without emitting carbon dioxide and other atmospheric pollutants.”
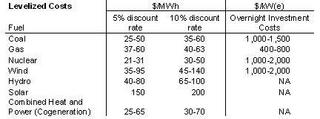
The first page of Lovins' new analysis displays the graph (below) of costs for each fuel. Many sources were used and many numbers were manipulated. His numbers could be exactly right but when someone has a preset bias and then manipulates numbers noted in the Appendix on page 18, then the graph and data becomes very questionable.
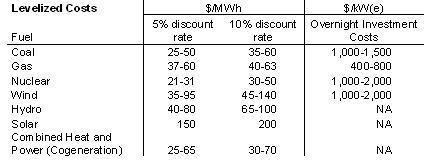
 To dispute Mr. Lovins’ economic figures I’ve got one and only one source that shows the levelized costs of each fuel globally. The only data manipulated was by the authors who applied the same level of scrutiny and objectivity to each fuel source. This data is from the International Energy Agency and the report is titled Projected Costs of Generating Electricity. Here’s what the Summary has:
 Deployment
Another issue I have with his analysis is the narrow timeframe of projected capacity additions. If you go back to the fifth page of the analysis, the projections only go to 2010. Well here's one source that goes to at least 2025.
According to the International Energy Outlook 2005 done by EIA, nuclear is far from “fading.” The data from this table points out that nuclear's capacity is projected to grow over the next 20 years from 359 GWe to 422 GWe (about another 60-70 plants). This projection does not include nuclear additions that will occur in the U.S. over the next decade due to the recently passed Energy Bill. Next year when EIA comes out with their new Outlook, we can expect to see a significant growth in capacity additions for nuclear.
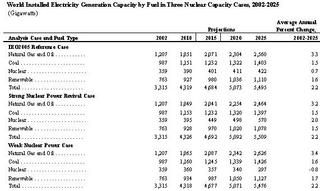
It should be noted that in the same table renewables and natural gas are projected to grow fairly substantially. That's great for them. We have no reason to argue why renewables and natural gas for cogeneration should not be in the future. But if the world wants clean, affordable and reliable energy, and do it in a world where carbon emissions may be heavily regulated, then nuclear power cannot be dismissed.
Climate Change
Here's my favorite line of the study:
Here's Mr. Lovins' solution to climate change:
We at NEI believe cogeneration, renewables and end use efficiency have important contributions to make if the world is to curb climate change. We think the nation and the world do need all energy options even though Mr. Lovins believes it has “no analytic basis.”
There are many strengths with cogeneration, renewables and end use efficiency as well as weaknesses. And we know there are many strengths with nuclear power as well as weaknesses. We just want to point out that there are plenty of data that show the opposite of Mr. Lovins’ claims and that nuclear energy has plenty of potential for the U.S. and the world for the future.
Technorati tags: Nuclear Energy, Environment, Energy, Electricity, Carbon Emissions, Rocky Mountain Institute, Amory Lovins
If David Bradish would kindly read what I wrote more carefully, and look up its heavily documented backup paper (www.rmi.org/sitepages/pid171.php#E05-08), he'll find he's wrong on every count. Our data were global, not U.S.-specific, and hence reflect global market conditions including fuel prices. All technologies' capacity factors are empirical. The capacity graph's URL points to the TWh/y as well as the GW graphs and data, carefully documented to the technology-specific data from the respective industries (and IAEA, WNA, IEA, etc); the TWh/y and GW graphs (total, not incremental) are in the fall 05 RMI newsletter on www.rmi.org. Post-2010 world nuclear capacity goes down, not up, because retirements overwhelm additions: see Schneider & Froggatt, Nucl. Eng. Intl. pp. 36-38, June 2005. And contrary to a later comment, our analysis explicitly excludes all big hydro (>10 MWe).Since Mr. Lovins asked, I went back and checked my work. Here's what I found:
My 1st count:
Nuclear power plants’ capacity factor (how efficient a plant generates electricity) is the highest of any fuel source (90.5%). Renewables are in the 30% range, natural gas for cogeneration is about 40%.This issue wasn’t addressed in the backup paper that Lovins references. It was found in the Methodology link under National Policy for Insecurity. RMI’s capacity factors for renewables and cogeneration differed from mine, but there, nuclear energy still had the highest capacity factor.
2nd count:
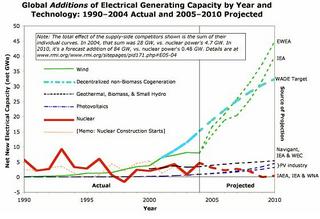
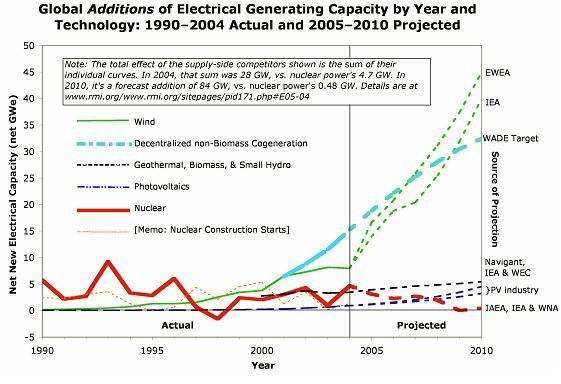
The second reason the graph is misleading is because of yearly capacity increases. The reader only sees what was built in that year. What you should see in the graph is the total operating capacity in existence today.No, this count still holds. To find the graph, go to the fifth page of Lovins' analysis. The Global Additions of Electrical Generating Capacity graph below deceives the reader because you are not showing the total additions added. When looking at the graph again, it appears nuclear dominated all other sources in capacity additions from 1990 – 2004 -- which isn't a conclusion I thought Lovins would like. Also, if the graph is looking at Net New Electrical Capacity, how does nuclear go into negatives in 1998?
3rd count:
The third reason the graph is misleading is because it uses five different sources for its information.This I did get wrong. It wasn’t five different sources, it was eight. It's important to remember that every source does not calculate their data on the same basis. When you start using multiple sources, the graph and its data lose their integrity. When you mix eight different sources together, that problem only becomes more pronounced.
4th count:
The fourth and final reason the graph is misleading is because it stops at 2010.The last time I checked, the world did not plan to stop in 2010. Just because the capacity additions in RMI's graph for nuclear are projected lower than wind and cogeneration, it does not mean that beyond 2010 they still will be.
When going back through my post, I found Mr. Lovins was correct about using global data versus U.S. All of his points used world figures, while most of my references were U.S specific.
After spending a couple of days checking out Mr. Lovins’ new analysis from the link in his comment, there are several issues I would like to discuss: costs, deployment and climate change.
Costs
Throughout the analysis, the author claims that nuclear power has no future because of its “bad economics.” Mr. Lovins bases nuclear’s entire economic case on one study done by MIT. Yet the study's purpose was to give an analysis of how and why nuclear power needs to be “an important option for the United States and the world to meet future energy needs without emitting carbon dioxide and other atmospheric pollutants.”
The first page of Lovins' new analysis displays the graph (below) of costs for each fuel. Many sources were used and many numbers were manipulated. His numbers could be exactly right but when someone has a preset bias and then manipulates numbers noted in the Appendix on page 18, then the graph and data becomes very questionable.
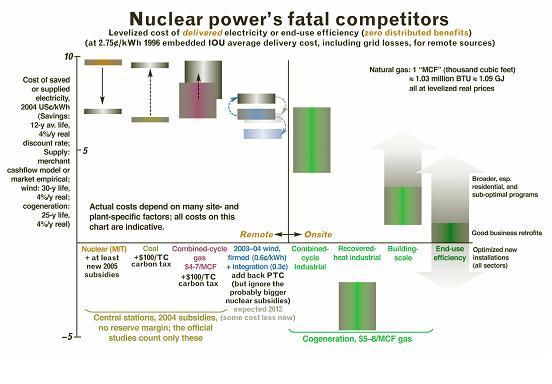 To dispute Mr. Lovins’ economic figures I’ve got one and only one source that shows the levelized costs of each fuel globally. The only data manipulated was by the authors who applied the same level of scrutiny and objectivity to each fuel source. This data is from the International Energy Agency and the report is titled Projected Costs of Generating Electricity. Here’s what the Summary has:
 Deployment
Another issue I have with his analysis is the narrow timeframe of projected capacity additions. If you go back to the fifth page of the analysis, the projections only go to 2010. Well here's one source that goes to at least 2025.
According to the International Energy Outlook 2005 done by EIA, nuclear is far from “fading.” The data from this table points out that nuclear's capacity is projected to grow over the next 20 years from 359 GWe to 422 GWe (about another 60-70 plants). This projection does not include nuclear additions that will occur in the U.S. over the next decade due to the recently passed Energy Bill. Next year when EIA comes out with their new Outlook, we can expect to see a significant growth in capacity additions for nuclear.
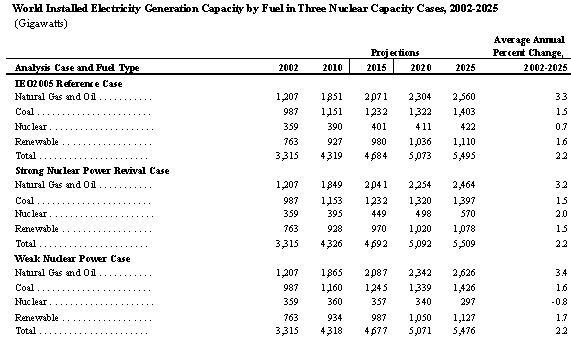
It should be noted that in the same table renewables and natural gas are projected to grow fairly substantially. That's great for them. We have no reason to argue why renewables and natural gas for cogeneration should not be in the future. But if the world wants clean, affordable and reliable energy, and do it in a world where carbon emissions may be heavily regulated, then nuclear power cannot be dismissed.
Climate Change
Here's my favorite line of the study:
"the effective carbon intensity of nuclear power is nearly six times greater than the direct carbon intensity of coal fired power."Does that really make sense? To those who do not know, nuclear power plants do not emit greenhouse gases. Many anti-groups argue that emissions occur during the overall lifecycle of nuclear power: mining, milling etc... but if you are going to use that argument then every fuel source does at one point or another emit GHGs during their lifecycle. Check out a previous post on life-cycle emissions.
Here's Mr. Lovins' solution to climate change:
much, indeed most, of the carbon displacement should come from end-use efficiency, because that's both profitable - cheaper than the energy it saves - and fast to deployEnd use efficiency is a great way to reduce carbon displacement because you are reducing the amount of electricity and energy consumed. But say theoretically the world is as efficient as it could possibly be with its energy. The world will still be growing and will still need sources of energy and electricity to keep up with demand.
We at NEI believe cogeneration, renewables and end use efficiency have important contributions to make if the world is to curb climate change. We think the nation and the world do need all energy options even though Mr. Lovins believes it has “no analytic basis.”
There are many strengths with cogeneration, renewables and end use efficiency as well as weaknesses. And we know there are many strengths with nuclear power as well as weaknesses. We just want to point out that there are plenty of data that show the opposite of Mr. Lovins’ claims and that nuclear energy has plenty of potential for the U.S. and the world for the future.
Technorati tags: Nuclear Energy, Environment, Energy, Electricity, Carbon Emissions, Rocky Mountain Institute, Amory Lovins
Comments
As a former submarine Engineer Officer with nearly two years worth of underwater time logged, you will never convince me that fission causes any kind of air pollution at all. I have been there, done the experiment and wear the tee shirt of someone who has breathed the air shared by a sealed up reactor plant.
I also find it very interesting that most of the ink or digits talking about the environmental benefits of nuclear energy - or dismissing them - focuses on carbon dioxide emissions. There are plenty of other reasons to favor nuclear fission power - the plants do not emit nitrogen oxides, microscopic particulates, sulfur oxides, selenium, uranium, or mercury either.
Here is the gold standard I apply to power plant technology - if it is clean enough to operate inside a submarine, it is clean enough to be my power plant of choice. Otherwise, its only grade can be "Needs improvement".
NEA's own technical appendix states that their numbers use 5 and 10% real discount rates for comparative purposes only, and that they have no indication that these are the appropriate values for use in a merchant plant setting.
Nor is it evident that the proper comparison between energy sources would apply the same real discount rate to every energy option. This is true even though the NEA tables (and your posting) are arranged in this manner for convenience sake. Investors would more likely apply a higher discount rate to new build nuclear (again, this is a true merchant setting, not one in which nearly all investor risks have been shifted to taxpayers) than for other energy sources.
Doug Koplow